- Lithium Facts
- Lithium Companies
South America
Brine & DLE Projects
Hard Rock Projects
More Coming soon!
North AmericaBrine & DLE Projects
Hard Rock Projects
- Blog
More Coming soon!
See how the valuation of the South American lithium companies & how their projects compare (Financial data updated on a daily basis)
Interested in how we put the analysis together? Click here
Price Adjusted Net Present Value / Enterprise Value
Net Present Value:
Project's valuation presented in technical reports.
Enterprise Value:
Is the current Market Cap - Cash + Debt.

Chart color: Project Stage –Read more
Measured & Indicated / Enterprise Value
Resource:
Potentially valuable, and for which reasonable prospects exist for eventual economic extraction.
Measured:
High level of confidence
Indicated:
Reasonable level of confidence
Inferred resource is not included
Chart color: Project Stage –Read more
Proven & Probable / Enterprise Value
Reserve:
Valuable and legally, economically, and technically feasible to extract
Proven Reserve:
90-percent or above likelihood of commercial extraction.
Probable Reserves:
Likelihood of recovery over 50-percent but under 90-percent.
![]()
Chart color: Project Stage –Read more
Price Adjusted Net Present Value / Enterprise Value
Net Present Value:
Price adjusted project valuation presented in technical reports. Based on $20,000/t LCE pricing found or interpolated from data in the technical reports.
Enterprise Value:
Is the current Market Cap - Cash + Debt.

Chart color: Project Stage, Read more
Price Adjusted Net Present Value (8%) & Enterprise Value
Net Present Value:
Price adjusted project valuation presented in technical reports. Based on $20,000/t LCE pricing found or interpolated from data in the technical reports.
Enterprise Value:
Is the current Market Cap - Cash + Debt.
Chart color: Project Stage, Read more
Do you want to know more about custom advertisement on Batteryjuniors.com? Contact us by clicking the button below!
M&I Resource / (EV/Price Adjusted NPV) / (Resource: Measured & Indicated/EV)
M&I:
Measured and Indicated Resource in Lithium Carbonate Equivalents (LCE)
EV/NPV:
Enterprise Value (EV) in relation to the project's Net Present Value (NPV)
Resource/EV:
Resource in Lithium Carbonate Equivalents (LCE) in relation to Enterprise Value (EV)
This section is too wide and is not yet available on mobile platforms. Visit through a tablet or a computer to access the analysis. Sorry for the inconvenience!
Size: Resource Estimate – All Company Projects (Inferred not included)
Chart color: Project Stage Read more
Advertisement
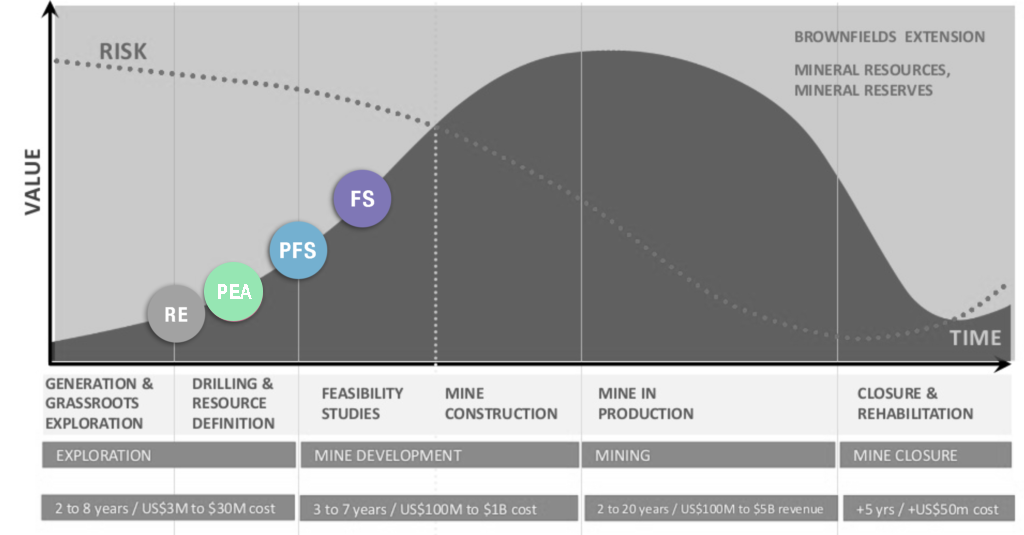
Only projects post-PEA stage
To be able to compare project economics, the analysis only includes projects post-PEA stage.
Pricing
The same price projection of $20,000/t LCE, or $2,000/t SC6 were used for all projects.*
Resource
Only the resource qualified as measured or indicated will be presented in the charts
*For projects where the company had chosen a pricing forecast different from the one used on this site, the NPV & IRR were interpolated from provided values in the companies released technical documents. More information on each projects NPV & sensitivity analysis on the relevant company’s profile page.
Chart colors: Based on the most recently released public technical report

The resource development stages: Where in the development cycle are the technical reports released?
Advertisement
| Cookie | Duration | Description |
|---|---|---|
| cookielawinfo-checbox-analytics | 11 months | This cookie is set by GDPR Cookie Consent plugin. The cookie is used to store the user consent for the cookies in the category "Analytics". |
| cookielawinfo-checbox-functional | 11 months | The cookie is set by GDPR cookie consent to record the user consent for the cookies in the category "Functional". |
| cookielawinfo-checbox-others | 11 months | This cookie is set by GDPR Cookie Consent plugin. The cookie is used to store the user consent for the cookies in the category "Other. |
| cookielawinfo-checkbox-necessary | 11 months | This cookie is set by GDPR Cookie Consent plugin. The cookies is used to store the user consent for the cookies in the category "Necessary". |
| cookielawinfo-checkbox-performance | 11 months | This cookie is set by GDPR Cookie Consent plugin. The cookie is used to store the user consent for the cookies in the category "Performance". |
| viewed_cookie_policy | 11 months | The cookie is set by the GDPR Cookie Consent plugin and is used to store whether or not user has consented to the use of cookies. It does not store any personal data. |