Comparing North American Lithium Projects
Comparing publicly traded North American Lithium Projects, project’s resource & reserve, economics, stage, opex & capex.
Project Map
Size: Measured & Indicated lithium resource,
Color: Stage (see chart below)
Sorry, the project map & project stage is not yet available on mobile platforms. Please visit this page with your tablet or laptop to see the comparison.
![]()
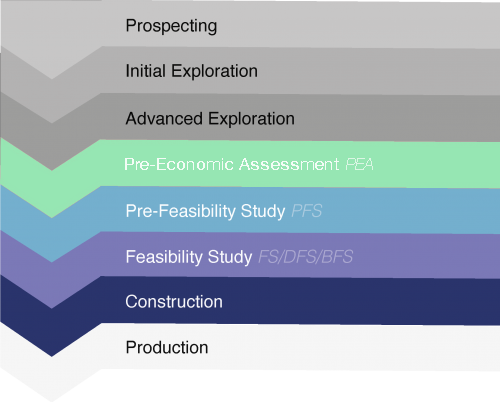
Chart color: Project Stage Read more
Project Stage
Project stage based on released technical reports from each company.
Size: Resource (Inferred not included), Color:Stage
Advertisement
Resource Size
Project resource based on the most recent technical reports from each company.
Resource Size
Project resource based on the most recent technical reports from each company.
Project Economics
All using the same forecasted pricing
After-Tax Net Present Value
After-Tax IRR
![]()
Chart color: Project Stage –Read more
Operating Cost per Tonne LCE
Initial Capital Costs
Project comparison
Sorry, the project comparison is not yet available on mobile platforms. Please visit this page with your tablet or laptop to see the comparison.
Advertisement
About the comparison
Only projects post-PEA stage
To be able to compare project economics, the comparison only includes projects post-PEA stage.
Pricing
The same price projection of $12000/t LCE, or $750/t SC6 were used for all projects.*
Resource
Only the resource qualified as measured or indicated will be presented in the charts
*For projects where the company had chosen a pricing forecast different from the one used on this site, the NPV & IRR were interpolated from provided values in the companies released technical documents. More information on each projects NPV & sensitivity analysis on the relevant company’s profile page.
Chart colors: Based on the most recently released public technical report

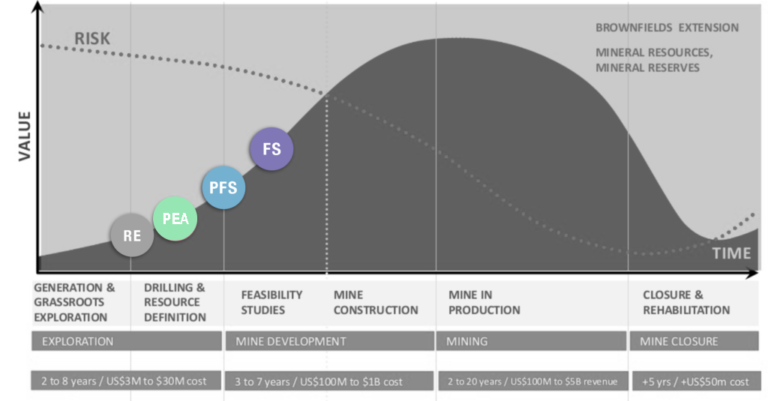
The resource development stages: Where in the development cycle are the technical reports released?

Advertisement
![LOGO [återskapat] LOGO [återskapat]](https://batteryjuniors.com/wp-content/uploads/elementor/thumbs/LOGO-återskapat-ozpr6tyjh3va1ifcopltktksqownqc64mplxytts9k.png)